This page contains some tricks for advanced Slide Score usage.
Using study overview
Study overview is the default page when you log in to Slide Score.
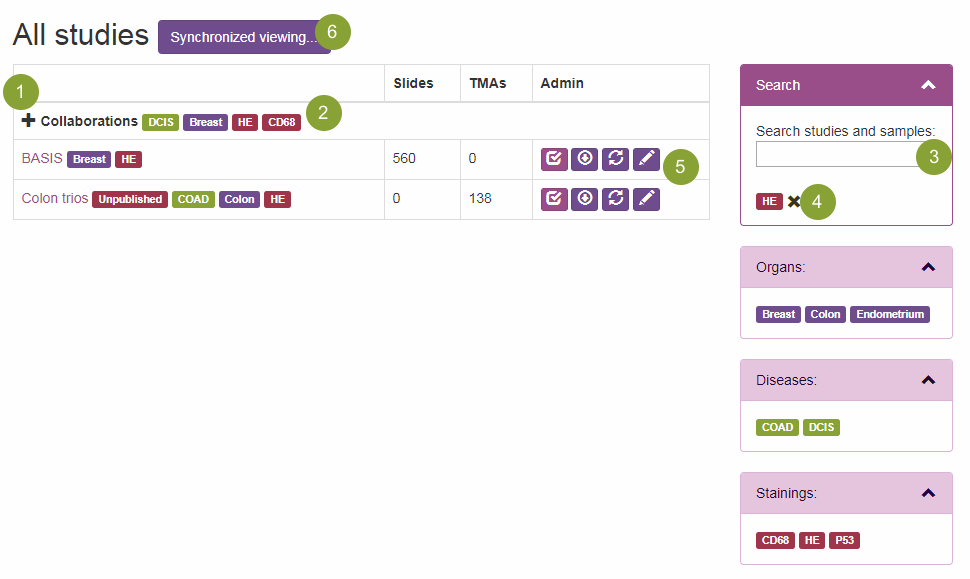
You can see all the studies that you have access to here arranged in folders. Folders can be opened by clicking the "+" button  to display the studies contained within.
Slide Score shows the staining(s), disease(s) and organ(s) within the study as "tags" next to a study (or folder)  . You can click a tag to quickly show only studies with the same tag.
You can do more filtering on the right side. Use the search box  to search study name, image names and TMA sample IDs for a value. You can combine this with searching by tags - all tags are displayed below the search box. You can return to the default view by clicking the red cross button
  or pressing Escape.
You can see the number of whole slides and TMAs to the right of the tags.
Each study has up to 4 quick access buttons  :
:
 Start Scoring - takes you directly to the first image or TMA core that you haven't scored yet in this study
 Download Results - download the file containing all answers submitted so far (see the Get results section for more).
  Reimport - re-import this study based on configuration files. This button only shows up for server administrators
 Edit Study - opens the administration screen for this study
It's possible to view up to 8 slides or TMA cores at the same time with Synchronized Viewing  . This is described in the section on Synchronized Viewing
Clicking the study name takes you to the overview of that study.
Using study view
Study view lists the slides contained in this study with their thumbnails, labels and an indication whether you've already scored them.

You can use the buttons next to the study name  to view/download results or edit the study in the administration screen (these buttons only show up if you have the right to do that). If you have QuPath integration enabled you will also see a button to download a QuPath project containing all the images in the study.
"Start Scoring!" button  will take you directly to the first image or TMA core that you haven't scored yet.
Search slide names or TMA core identifiers using the search box  .
.
Slides can have a thumbnail and a label (these can be switched off in the administration screen), name, whether it's scored (or a percentage of the TMA cores that have been scored) and a button to open the image in QuPath if you have QuPath integration enabled.
To go back to overview of all studies click 
Get results
If the administrator of the study gave you the right to download results you can download the slides' scores at any time by going to the study overview and clicking the download button with an arrow pointing down.
Another option is to open the study view by clicking its name and click "Download Results". This page also has "Results" button - this will show the scores in your web browser. Note that only the first 1000 answers are shown, you have to download the file for the rest.
Results for TMA studies don't include cores that were marked as not available.
Results are arranged one answer per line, each line contains the image that was scored, by whom, which question was answered, details of a TMA core if it is a TMA and the value of the answer.
For whole slide studies with questions other than annotation and free text there is another way to view the results: "Results Comparison". You can see how many people answered each possible answer for each whole slide the consensus and how your scores compare with others. It is useful for assessing concordance for each slide. You can access it from the Results view.
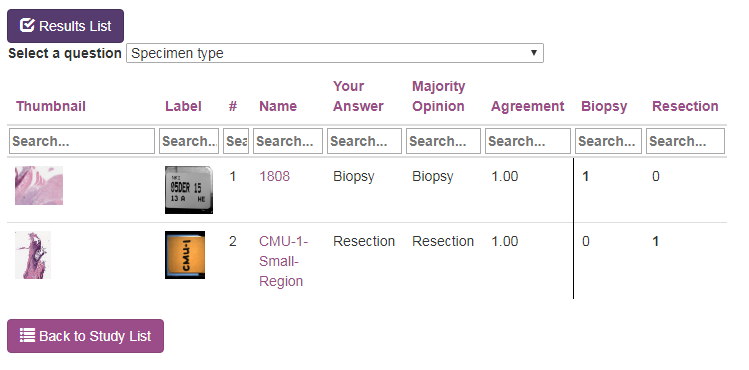
You can click the header of a column to sort the list by that column or type into the text field under the header to filter it.
Two-factor authentication
Data in Slide Score can be quite sensitive. If you want to secure your account from hackers you can enable the so-called two-factor authentication - to login you will need a one time code from a special app on your smartphone next to your email and password. Hackers will have a much harder time stealing your account!
2 step verification needs some basic setup. You will need to download an authenticator app that will receive the code and configure it to work with Slide Score.
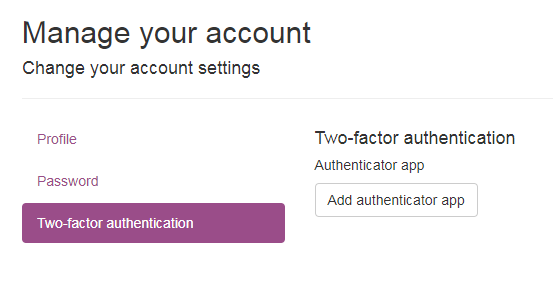
To start login to Slide Score and click your username in upper right corner. This will open your account settings. On the right select "Two-factor authentication". You may need to reenter your password to confirm your identity. Then click the "Add authenticator app" and follow the steps outlined there.
You can set it up on multiple devices so that you always have access.
If you lose your phone and are worried that someone might access your account you need to reset the authenticator key. That option will be enabled in the "Two-factor authentication" menu once you configure your authenticator app.
Tips when scoring
Keyboard control
Using mouse for extended periods can cause RSI (repeated strain injuries). We understand that scoring slides can be addictive but you should always take breaks.
To help avoid risk of RSI Slide Score supports a lot of keyboard controls.
When viewing a slide:
-
Arrow keys (or W, A, S and D) pan the slide. You can hold them to move around rapidly.
-
Holding shift while pressing left and right arrow keys results in finer movements.
-
Holding shift while pressing up and down arrow keys zooms in and out a small amount, respectively.
-
Q and E zooms in and out a larger amount, respectively.
-
X (or number 0) zooms out so that the whole slide fits the screen.
-
Number keys 1-5 (in the alphanumeric part of your keyboard not numpad) zoom in to a predefined level.
If you press one of these keys and nothing happens it could be that the slide viewer is not receiving keyboard input. Click the slide or pan it with the mouse to fix that.
Predefined magnification levels
You can set a magnification level using either a keyboard shortcut (as described above) or a button in the top part of the viewer that resembles an objective with a color band indicating the level. These levels are similar to common microscopes, from small magnification to large: red, orange, green, blue and white.

The magnification levels don't exactly correspond to any magnification that you would see using a microscope because viewing a slide digitally is just such a different experience. But the ratios between them are the same as between these objectives: 10x, 40x, 100x, 400x and 1000x.
These well-defined magnification levels can be handy when using the synchronous view of slides that have different sizes. For example, if there were originally only H&Es stainings and later some IHC slides were made it can happen that they have slighly different scanned area. If you set up synchronous viewing with them they would have slightly different zoom levels by default. You can uncheck "Keep synchronized" and press 1 on each slide to view them at the same zoom level.
Measure and microscope
Slide Score viewer includes tools for measuring the distance between two points and the area of an ellipse, rectangle or a hand drawn shape. To use them click "Measure distance and area" just under the scoring panel.
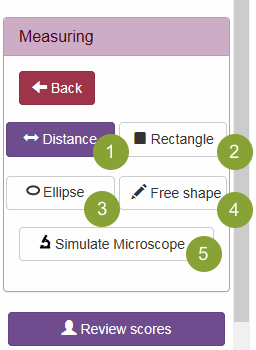
As long as you have this panel opened holding the mouse button when moving the mouse will draw a shape instead of panning the view. Note that the shape will only be visible as long as you hold the mouse button, when you release it, it disappears. To close this panel click the "Back" button.
You can select the type of shape by clicking the buttons in this panel:
- "Distance"
 draws a line with a little balloon showing the length of the line in micro- or milimeters.
 - "Rectangle"
 draws a rectangle and shows its area.
 - "Ellipse"
 draws an ellipse.
 - "Free shape"
 allows you to draw any shape with your mouse and displays its area.
The last button "Simulate Microscope"  works a bit differently. When you click it the whole view darkens with the exception of a circle with area 0.2mm² (a similar area you would see when looking at the slide with a microscope at 40x). You can drag this circle around - as if you're looking at the slide with a microscope. This is useful for following scoring methodology written for microscopes - for example the CAP protocol for mitotic score requires you to count mitosis in 10 fields of view at 40x. You can drag outside the circle to pan the view. Press the same button again or press Ctrl+M to hide the field of view.
Note: Field of view at particular magnification shouldn't really be seen as a standard area, different occulars can introduce differences on the order of 2x. It's better to use actual area in mm². See this paper for more https://journals.sagepub.com/doi/full/10.1177/0300985815593349.
Annotation
The last two question types in the scoring sheet editor are for marking cells or circles of predefined size (Annotate Points) or annotating interesting areas (Annotate shapes).
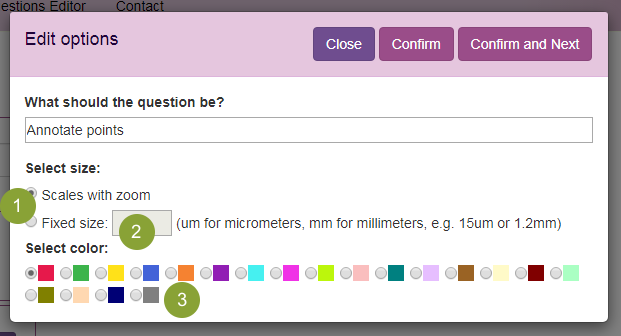
"Annotate points" can be configured  in two modes:
- "Scales with zoom" - This allows raters to indicate points on the slide with a circle that gets smaller as you zoom in on the slide so that it's always visible but doesn't get in the way
- "Fixed size" - Using this option you can create a question for indicating individuals cells or nuclei (if you set the size
 to "5um" - 5 micrometers) or areas for DNA extraction or TMA cores (setting the size to for example 1.2mm). Circles indicated with this question will always keep the actual size - so if you set it to 5um they will not be visible when looking at the whole slide until you zoom in.
You can select one of the colors  for outline of the annotation circles.
"Annotate shapes" can also be configured with one of the colors.
Using Annotation tools
Annotation questions appear initially collapsed just with a button "Add annotations". Clicking it will change the function of the mouse on the slide viewer. For "Annotate points" questions clicking the slide will add a point at that location - note that if the question is configured as fixed size (and with very small size) you may not see it without zooming in. You can hold the mouse button to drag the point around and right click it to remove it. Note that you have to Submit your annotations to save them.
"Annotate shapes" questions are a bit more sophisticated, clicking the "x shapes" button will quickly flash green circles around existing shapes (to make them easier to find) and open the panel with annotation tools:
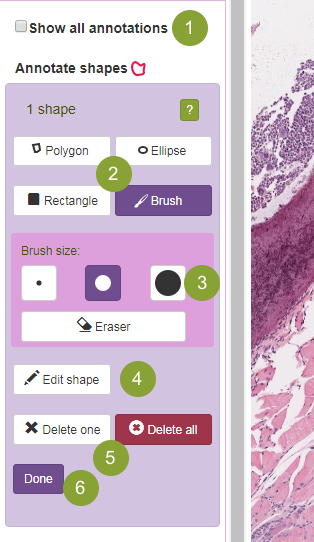
Even before you open the panel if there is more than 1 question with annotations, the "Show all annotations"  checkbox will show up. Checking it will display all annotations from all questions in a "read-only" mode - you will not be able to change them.
When you're satisfied with your annotations you click the Done button  to close the panel and regain normal function of the mouse for panning the slide.
The annotation tool panel itself is dominated by the buttons for tool selection  "Rectangle" and "Ellipse" work similarly as the measurement tools but they don't disappear after you release the mouse button. You can drag them around with your mouse. Right clicking the shape will delete it. Note that shapes can overlap.
Using "Polygon"
Polygon is useful for annotating irregular areas - lesions, tissues and so on. To create a polygon click the slide to create a start point and then click again to create a straight connecting line or drag to draw precise outline. If you click the start point, or drag to it, the polygon will complete. You can cancel it by pressing escape key or right clicking with your mouse. Pressing delete key will remove the last point on the polygon.
Editing shapes
If you make a small mistake you can correct it by clicking the Edit Shape button  and clicking the shape you want to correct. This will create small black draggable rectangles around the edges that you can drag to adjust the shape. Note that with polygons the number of draggable rectangles depends on your zoom so if you need more control you can zoom in. Rectangles drag the neighboring points on the polygon with them so you can make large scale changes when you zoom out. For finer changes it's best to use the "Brush" tool:
Once you have made some shapes you can use the "Delete one" or "Delete all" buttons  to remove them. Delete one will turn your cursor into a crosshair and if you click a shape with it it will be deleted. Note that there is no undo, yet.
Using "Brush"
"Brush" will change your mouse cursor into a small circular brush (you can configure its size with  ) that you can use to fill the shape you want to annotate by dragging the mouse. It works best on a tablet with a stylus, but it's possible to precisely annotate areas with a mouse, too. If you drag while holding the right mouse button it will erase instead of fill, you can also switch to erasing by pressing the Eraser button.
If you touch another shape (Polygon, Ellipse or Rectangle) while dragging with the brush (or Eraser) it will merge the shape with the brush area. You can use this to make small effective changes to the shapes.
Note that if you use Apple Pencil ® on Apple iPad ® you can drag the slide with your fingers and brush with the pencil without switching tools - on a regular computer it's best to move around using the keyboard.
QuPath Integration
QuPath is a great open-source image analysis tool with user-friendly interface.
Slides hosted in Slide Score can be opened in QuPath directly using the QuPath plugin for Slide Score. This way you can analyze Philips iSyntax files in QuPath for example.
To use QuPath with Slide Score:
- Click your username in upper right corner to open your settings page
- Make sure "QuPath Integration" is checked
- Press Save
- Download the QuPath plugin for Slide Score or click the
 link in the image below
 - Start your QuPath
- Drag the downloaded plugin file onto QuPath window and follow the instructions
Once this setup is done you're ready to open slides from Slide Score in QuPath.
If you have used the plugin before make sure that the old version of the plugin is removed from your user directory (for example C:\Users\yourname\QuPath\Extensions) before installing the new one.
Follow these steps to open a slide in QuPath:
- Go to the study you want to work on
- Click "Open in QuPath" button next to an image you want to open
- A dialog opens with a link to the image.
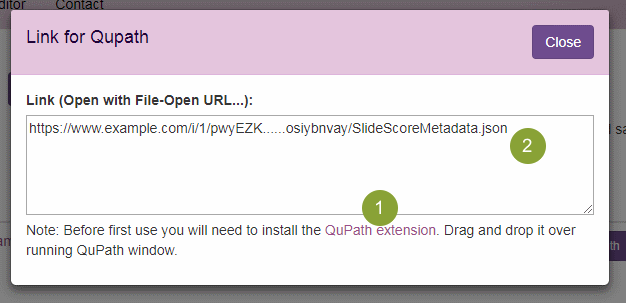
- Copy the URL

- In QuPath open the File menu and click the Open URL...
- Paste the URL to open the image!
You can also open the whole study in QuPath, so that your image analysis script can be run on all the slides in the study:
- Go to the study you want to work on
- Click "Open in QuPath" next to the study name. This will download a QuPath project file (with .qpproj extension) containing the links to all the study images.
- Save this downloaded file to an empty folder. QuPath will create additional files and folders in this folder.
- Open the QuPath project file by double clicking it or open QuPath and open it with File-Project-Open project menu item.
When you open the project for the first time it will take some time before thumbnails of all the slides are available.
The links in the project file contain tokens that allow opening the images as if you did it. So, if you share it with other people they will have access to them as well under your account name. Note that it's possible to answer the scoring sheet from within QuPath so don't share these image files with people you don't trust.
Note that links for QuPath are only valid for 1 year. You need to get your project file refreshed if you plan to continue using it.
When viewing a Slide Score image in QuPath (doesn't matter whether by pasting a link or opening a project file) you can also import the TMA positions from Slide Score (through menu: TMA-Import TMA positions from Slide Score, note that TMA cores marked as controls, empty or unavailable will be placed at coordinates 0,0 by QuPath. They can be ignored) and upload answers to questions in Slide Score (using scripts only).
Here is a minimal example of a script using the Slide Score server to upload annotations and answers:
import qupath.lib.gui.QuPathGUI
import qupath.lib.images.servers.slidescore.SlideScoreImportTMAsCommand
import qupath.lib.images.servers.slidescore.SlideScoreUploadAnnotationsCommand
import qupath.lib.scripting.QP

// load SlideScoreImportTMAsCommand
qupathGUI = QuPathGUI.getInstance()
def slideScoreImportTMAsCommand = new SlideScoreImportTMAsCommand(qupathGUI)

for (projectimageentry in project.getImageList()) {
    // get some properties of the image
    def imagename = projectimageentry.getImageName()
    def imagedata = projectimageentry.readImageData()
    def server = imagedata.getServer()
    //use ((SlideScoreImageServer)server).getQuestions() to download the list of questions in the scoring sheet

    // load TMA core locations from SlideScore
    slideScoreImportTMAsCommand.run(imagedata)

    def hierarchy = imagedata.getHierarchy()
    def grid = hierarchy.getTMAGrid()
    def cols = grid.getGridWidth()
    def rows = grid.getGridHeight()
    for (int rownr = 0; rownr<rows; rownr++) {
        for (int colnr = 0; colnr < cols; colnr++) {
            def tmaCore = grid.getTMACore(rownr, colnr)
            if (tmaCore && tmaCore.isTMACore() && (!tmaCore.isMissing())) {
                //run your image analysis across all TMA cores

                def detections = tmaCore.getChildObjects()
                def myAnnotations = []
                for (detection in detections) {
                    myAnnotations.add(PathObjects.createAnnotationObject(RoiTools.fillHoles(detection.getROI())))
                }
                if (myAnnotations.size()>0) {
                    slideScoreUploadAnnotationsCommand.submitTMAAnnotations(imagedata, myAnnotations, "Example question in the scoring sheet", tmaCore)
                }
            }
        }
    }
}

//or submit simple answers for the whole image:
def slideScoreUploadAnnotationsCommand = new SlideScoreUploadAnnotationsCommand()
slideScoreUploadAnnotationsCommand.submitSlideAnswer(imagedata, '% from QuPath Example', "60")
//or submit annotations for the whole slide
slideScoreUploadAnnotationsCommand.submitAnnotations(imagedata, myAnnotations, "Example question in the scoring sheet")
Following new developments
We work hard on making Slide Score the best platform for digital pathology. When we add a new feature we write about it on the "What's new" page